How high can silver fly?

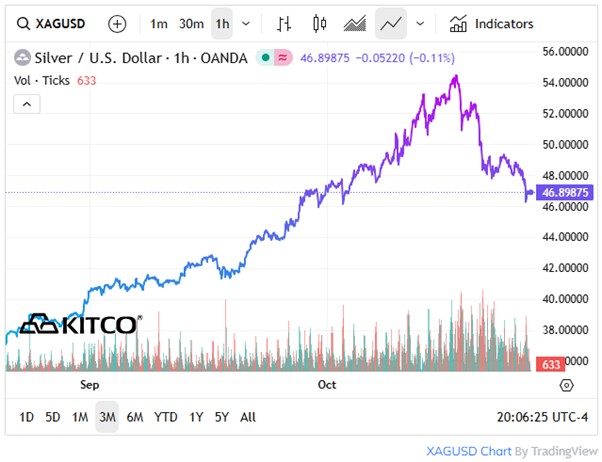
The price of silver plunged 7% to $48 last month, marking the first real hiccup in a relentless rally that culminated with a nominal all-time high above $54.
Since that healthy correction, the white metal has reacquainted itself with $49 and now appears to be entering a period of high-level consolidation before the next leg-up.
In the meantime, it is possible that silver’s volatility exposes investors to some short-term downside, with a moderate Fibonacci retracement toward $43 not entirely out of the question.
However, with the gold-silver ratio still historically high, and with many of the catalysts behind silver’s surge beyond $50 still in play, most investors remain squarely focused on silver’s upside.
To understand the degree to which silver could outperform, we first need to ascertain the extent to which it is undervalued, overvalued, or fairly valued relative to historical bull cycles.
Fiat currencies are an extremely poor measuring stick for this task because of their inability to hold purchasing power, so gold remains the optimal lens to apply when valuing the silver price.
Historically, silver’s value relative to gold has been 7:1 — a ratio which is ironically proportionate to 2024 gold and silver mine production — and even hit lows of 2:1 in Ancient Egyptian times.
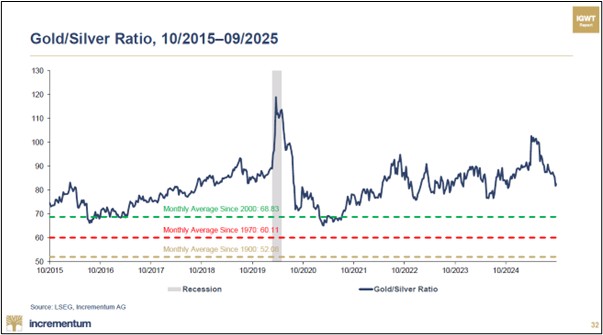
More recently, the gold silver ratio (GSR) has averaged 68.83 since 2000, 60.11 since 1970, and 52.08 since 1900. At today’s $4,105 gold price (at the time of writing this article), that equates to a silver price between $60 and $79.
Assuming the gold price stays around $4,105, this means that silver could rise a further 23% to 62% from today’s price of around $48.62. That is, if today’s GSR of 85.4 reverted to its historical mean of 52 to 68.
To some, a 23% to 62% increase may seem conservative. And frankly, it is, since it assumes that the GSR will not go lower than 52 — an endgame that we, and Tavi Costa, rate as highly unlikely.
“Gold bull cycles do not typically peak with the gold-to-silver ratio as high as 85. For perspective: In 1980, the ratio fell below 20. In 2011, it dropped to 30 before gold peaked a few months later. Given the scale of today’s economic imbalances, a sharp contraction in the gold-to-silver ratio toward historic lows is highly likely, in my view,” Tavi Costa, Crescat Capital.
Put simply, the closing act of a gold bull market has historically seen a rapid compression of the GSR, to levels ranging between 45 and 14 — the latter being the all-time low from January 1980.
Admittedly, an anomaly came in March 2020, when the GSR soared to a record 124.04. From this peak to its cycle lows of 69.54 in August 2020, the GSR shed approximately 54.5 points.
For reference, the GSR peaked at 107.23 in April 2025 and has since fallen approximately 22 points to 85. So, if we see a similar drop in the GSR today as we did in 2020, there is still another more than 30 points to go.
In other words, the most recent silver bull market indicates that the GSR’s reversion in today’s cycle is far from complete. And by extension, that means much of silver’s upside may lie ahead.
Speaking of upside, if we assume that gold stays at $4,105, a 20 to 30 GSR would translate to a $137 to $205 silver price, implying an additional 182% to 322% upside from today’s $48.62 level.
If we take it a step further, the GSR returning to its 1980 low of 14 at a gold price of $4,105 would imply a $293 silver price — a staggering almost 503% increase from today’s $48.62 price.
Arguably, a decline in the GSR to historically low levels would render silver overvalued versus gold. That said, a $293 silver price starts to look cheap, when adjusting for “shadow” inflation.
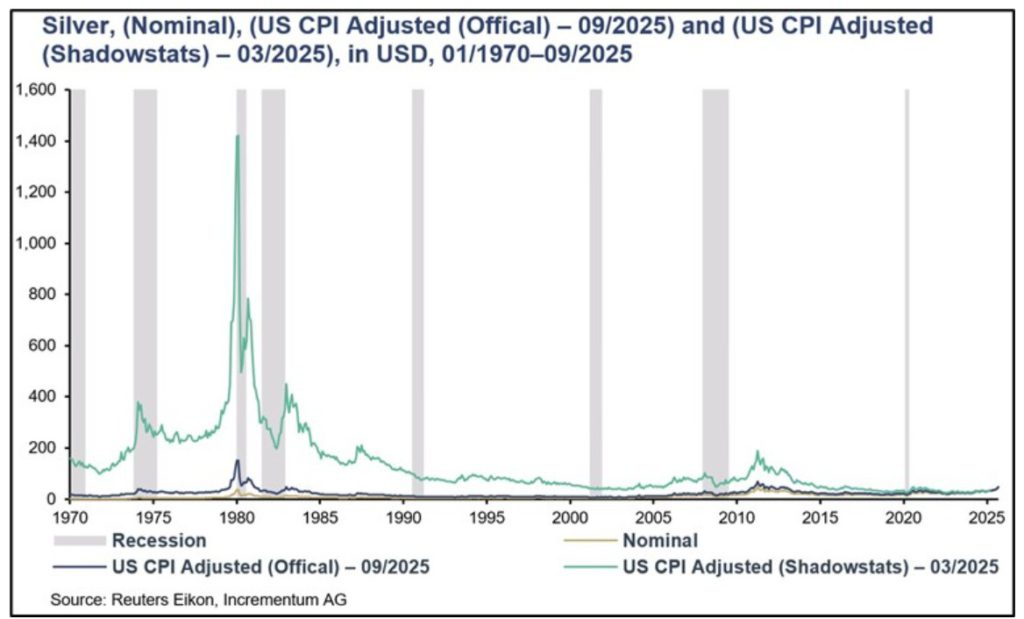
Indeed, as the exceptional chart from Incrementum illustrates, silver’s all-time high in 1980, when adjusted for real inflation numbers from Shadowstats, comes in at approximately $1400.
Shadowstats inflation diverges from official U.S. CPI data because it reconstructs inflation using pre-1990s government methodologies, before “revisions” diluted how price growth is measured.
In essence, it shows what inflation would look like if measured the same way it was in 1980, revealing that today’s asset prices are not nearly as overvalued as they appear under official CPI.
Importantly, us drawing on this data is not to say that silver is going to $1400 tomorrow. Rather, we do it to contextualize how cheap silver remains in an era of chronic monetary debasement.
Still, even if we adjust for the more conservative, albeit inaccurate, official CPI figures, silver’s 1980 all-time high comes in at approximately $150, which is roughly three times where we are at 45 years later.
Ultimately, whether silver reaches $151, let alone the lofty heights of $1400, the reality is that $48 silver is still a whole lot better than the $20 to $25 price we were stuck with for the past decade.
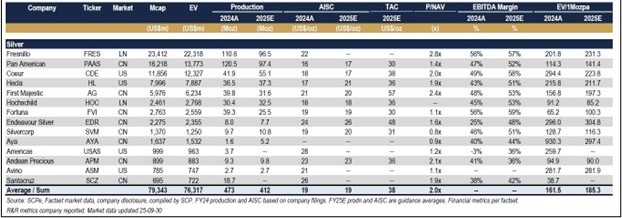
As a result, most of the silver majors and mid-tiers are booking a cool approximately 60% profit margin already, with the industry average AISC expected to be around $19 in 2025.
In this sense, the handful of primary silver miners that exist in today’s market do not need the silver price to go above $50 to turn a profit. In fact, they would even be fine at $30 to $35.
Naturally, we find ourselves in a sweet spot for silver stocks, where share prices are starting to reflect higher metal prices, but have not yet priced in the leveraged effect of future cash flows. 
Ted Butler is a senior analyst for The Silver Advisor and The Gold Advisor.
A slightly modified version of this article was published elsewhere.
Related Posts

Eldorado Gold’s Lamaque Complex wins prestigious mining sustainability award
JV article: Great Pacific Gold sharpens focus in Papua New Guinea

New Afton Mine deploys advanced 5G network for underground operations

Springpole gold mine faces final public environmental review

More mines join federal fast-tracking program: Part 2
March 2, 2026
Comments