Top 40 revenues top $206 billion
Gold, margins and new production reshaped the 2025 Top 40



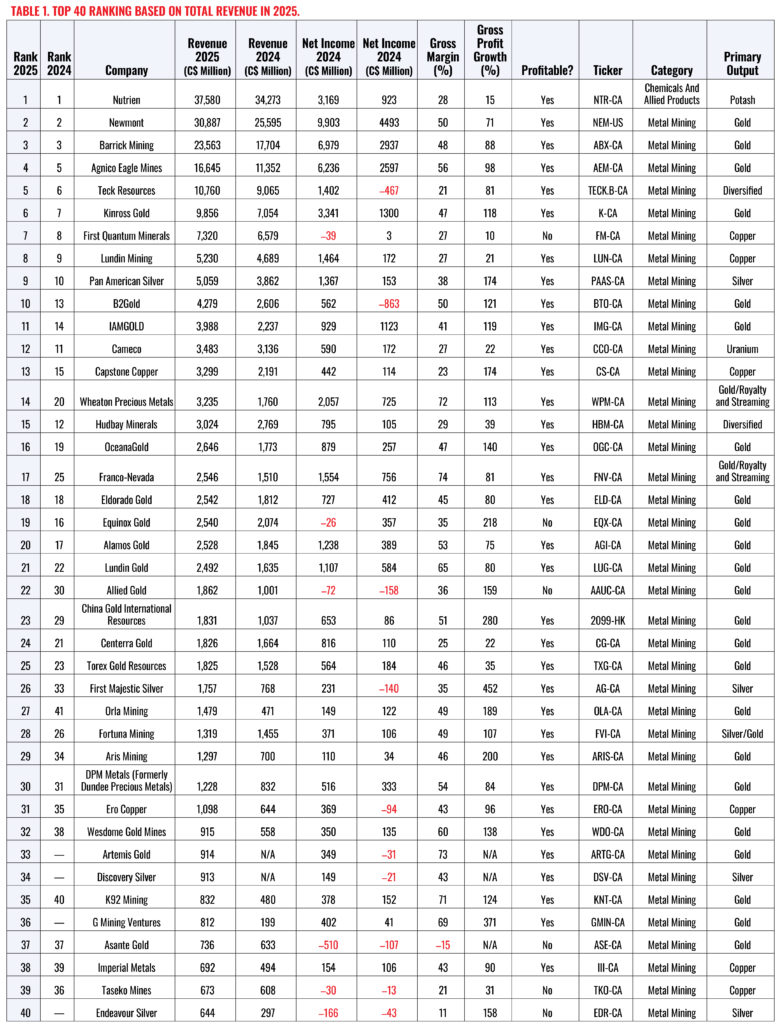
The 2025 ranking of the Top 40 Canadian mining and metals companies by total revenue shows a sector that expanded sharply, became more profitable and leaned even more heavily toward precious metals.
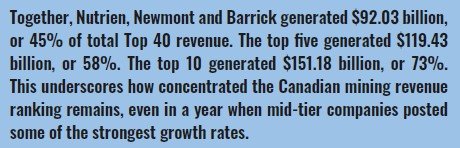
The Top 40 generated $206.15 billion in combined 2025 revenue. Among the 38 companies with comparable 2024 revenue figures in the Table 1 (two companies out of the Top 40 had their projects still in development stage in 2024), revenue rose from $158.89 billion in 2024 to $204.33 billion in 2025, a gain of 28.6%. That growth was not evenly distributed. It was driven by the largest gold producers, several fast-rising mid-tier names, royalty and streaming companies and new or newly scaled production entering the list.
The market set the stage. The World Gold Council said the LBMA PM gold price set 53 new all-time highs in 2025, as the annual average gold price reached US$3,431 per ounce, up 44% year over year. That pricing environment helped explain why gold producers dominated the ranking by both revenue and profitability.
The 2025 Top 40 shows a stronger, more profitable and more precious-metals-weighted sector. Revenue rose sharply, gold remained the clear driver of both scale and profitability, and new production, acquisitions and high-margin mid-tier growth reshaped the middle and lower parts of the ranking. The year was not only about higher revenue, but it was also about quality of revenue.
KEY HIGHLIGHTS AND MOST NOTABLE DYNAMICS: FAREWLL NEWMONT
Nutrien retained the #1 position, with $37.58 billion in revenue. The company accounted for 18.2% of total Top 40 revenue on its own. Its leadership keeps potash at the top of the ranking, even though gold was the dominant commodity across the wider list. Nutrien’s 2025 results were supported by higher fertilizer net selling prices, record upstream fertilizer sales volumes and stronger retail earnings, while potash adjusted earnings before interest, taxes, depreciation and amortization (EBITDA) rose to $3.15 billion because of higher net selling prices and record sales volumes.
Newmont held the #2 spot with $30.89 billion in revenue and led all companies in net income, at $9.90 billion. The company’s 2025 results pointed to full-year production of 5.9 million attributable gold ounces, including 5.7 million oz. from its core portfolio, and an average realized gold price of US$3,498 per ounce for the year. Unfortunately, Newmont is expected to fall off the list next year because it no longer appears to meet two of CMJ’s three eligibility criteria: as of the end of 2025, it is not domiciled in Canada and has announced a voluntary delisting from the TSX. It also completed the sale of its remaining Canadian operations, including Musselwhite, Éléonore and Porcupine, removing the Canadian operating-mine exposure that supported its prior inclusion.
Barrick Mining stayed at #3, with $23.56 billion in revenue and $6.98 billion in net income. Barrick’s reported 2025 revenue was up 31% from 2024, while operating cash flow increased by 71%.
Agnico Eagle Mines climbed to #4, with $16.64 billion in revenue and $6.24 billion in net income. Agnico said it achieved its 2025 production guidance and produced 3.45 million oz. of payable gold.
GOLD REMAINED THE CENTRE OF GRAVITY
Gold remained the clearest driver in the 2025 Top 40 ranking. It was listed as the primary output for 23 of the Top 40 companies, generating $117.52 billion, or 57% of total Top 40 revenue. If the two gold royalty and streaming companies — Wheaton Precious Metals and Franco-Nevada — were added, gold-linked revenue would rise by another $5.78 billion, bringing the total to $123.30 billion, or 60% of the total.
The strength was not limited to the largest producers. Gold names also dominated the strongest margin performers. Table 1 shows K92 Mining with a 71% gross margin, G Mining Ventures with 69%, Lundin Gold with 65%, Wesdome Gold Mines with 60%, Agnico Eagle Mines with 56% and Alamos Gold with 53%.
That is one of the clearest themes in the 2025 ranking: gold did not just lift revenue; it lifted margins and net income. The strongest gold companies turned higher prices into cash, earnings and rank movement.
THE BIGGEST CLIMBERS
The most dramatic rank movement came from companies that added scale, benefited from stronger precious metal prices or entered the Top 40 through new production.
Orla Mining was the biggest climber, rising from #41 in 2024 to #27 in 2025, a gain of 14 spots. Its revenue increased from $471.19 million to $1.48 billion, a gain of 214%. Orla’s 2025 transformation was supported by the Musselwhite acquisition, which the company described as a pivotal step in its evolution into a geographically diversified, multi-asset intermediate gold producer.
Franco-Nevada and Allied Gold each climbed eight spots. Franco-Nevada moved from #25 to #17, with revenue rising 69% to $2.55 billion. Allied Gold moved from #30 to #22, with revenue rising 86% to $1.86 billion, although it remained loss-making, with a net loss of $72 million.
First Majestic Silver climbed seven spots, from #33 to #26, with revenue rising 129% to $1.76 billion. It also posted the strongest gross profit growth in the ranking, at 452%.
Wheaton Precious Metals, China Gold International Resources and Wesdome Gold Mines each climbed six spots. Wheaton’s move was especially notable because it combined scale with margin strength: $3.24 billion in revenue, $2.06 billion in net income and a 72% gross margin.
B2Gold was another notable climber in the ranking, moving up three spots to #10 from #13 in the previous year’s ranking. The gain reflects its stronger relative revenue performance and places the gold producer among the top 10 Canadian miners by total revenue.
NEW NAMES IN THE TOP 40
Table 1 shows four companies entering the 2025 Top 40 with no 2024 rank: Artemis Gold, Discovery Silver, G Mining Ventures and Endeavour Silver.
Artemis Gold entered at #33, with $914 million in revenue, $349 million in net income and a 73% gross margin, the second-highest gross margin in the table. Discovery Silver entered at #34, with $913 million in revenue and $149 million in net income. G Mining Ventures entered at #36, with $812 million in revenue and $402 million in net income. It had the strongest calculated revenue growth among companies with 2024 revenue in the table, rising 308% from $199 million. Endeavour Silver entered at #40, with $644 million in revenue, but a net loss of $166 million.
MARGINS AND PROFITABILITY: MARGIN STRENGTH SEPARATES THE LEADERS FROM THE REST
The gross margin and profitability data add another layer to the Top 40 ranking, showing not only who generated the most revenue, but also who converted that revenue most effectively into gross profit and net income.
On a revenue-weighted basis, the Top 40 generated an implied $85.46 billion in gross profit, equal to a 41.5% weighted gross margin. The median gross margin was 45.4%. The strongest gross margins were led by royalty and streaming and high-margin gold names: Franco-Nevada at 74%, Artemis Gold at 73%, Wheaton Precious Metals at 72%, K92 Mining at 71%, G Mining Ventures at 69% and Lundin Gold at 65%. At the lower end, Asante Gold posted a negative gross margin of –15%, while Endeavour Silver posted 11%, Taseko Mines 21%, Teck Resources 21% and Capstone Copper 23%.
Profitability was broad, but not universal. Of the Top 40 companies, 34 were profitable and six were not. Combined net income was $49.46 billion. The largest contributors were Newmont at $9.90 billion, Barrick Mining at $6.98 billion, Agnico Eagle Mines at $6.24 billion, Kinross Gold at $3.34 billion and Nutrien at $3.17 billion. The loss-making companies were First Quantum Minerals, Equinox Gold, Allied Gold, Asante Gold, Taseko Mines and Endeavour Silver.
Gross profit growth also showed where momentum was strongest. First Majestic Silver led by a wide margin, with growth of 452%. G Mining Ventures followed at 371%, while China Gold International Resources ranked third at 280%. Five companies posted gross profit growth above 200%: First Majestic, G Mining Ventures, China Gold International Resources, Equinox Gold and Aris Mining.
The lower end remained positive. First Quantum Minerals had the lowest reported gross profit growth at 10%, followed by Nutrien at 15%.
OTHER KEY COMMODITIES
Copper accounted for six companies — First Quantum Minerals, Lundin Mining, Capstone Copper, Ero Copper, Imperial Metals and Taseko Mines — with combined revenue of $18.31 billion, or 8.9% of the Top 40 total revenue. The group remained strategically important but financially mixed, with First Quantum and Taseko posting losses.
Silver also had a stronger presence. Pan American Silver ranked #9, with $5.06 billion in revenue and $1.37 billion in net income. First Majestic Silver ranked #26, Discovery Silver entered at #34, and Endeavour Silver entered at #40.
Cameco was the only uranium-primary company in the Top 40. It ranked #12, with $3.48 billion in revenue, $589.79 million in net income.
COPPER SCALE AND GOLD CONSOLIDATION DEFINE 2025 M&A
Among 2025 transactions tied directly to companies in the 2025 Top 40 ranking, two deals stand out for reshaping the competitive landscape. The largest was the proposed Anglo American–Teck Resources merger, a US$53-billion copper and critical minerals transaction that would create one of the world’s largest copper producers and put Vancouver at the centre of a global mining heavyweight. For Teck, ranked fifth in the Top 40, the deal would mark a defining shift from Canadian diversified miner to core pillar of a much larger copper-focused platform.
In gold, Equinox Gold’s roughly US$2-billion acquisition of Calibre Mining was the most consequential consolidation move involving a Top 40 company. The combination created a larger Americas-focused producer with production approaching one million oz. and a portfolio spanning Canada, the U.S., Nicaragua and Brazil. Together, the deals underline the year’s dominant themes: copper scale, critical minerals positioning and gold-sector consolidation.

NET PROFIT MARGIN RATIO ANALYSIS: TABLE 2
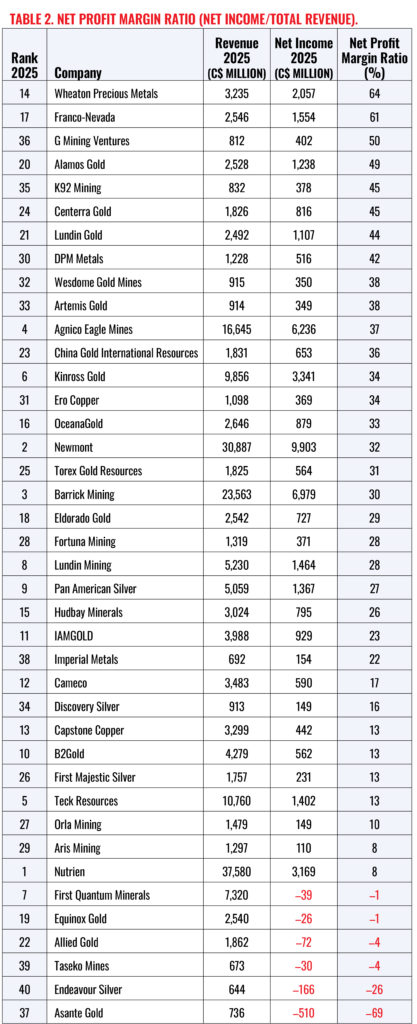
Table 2 highlights a sector with strong earnings power at the top, but clear pressure among weaker-margin and loss-making companies. It shows a profitable but sharply divided Top 40, with 34 companies reporting positive net profit margin ratio and six posting losses. Together, the Top 40 companies generated an implied combined net profit margin of about 24%.
Wheaton Precious Metals led the ranking by net profit margin, at 64%, followed by Franco-Nevada at 61%. They were the only companies above 60%, setting them apart from the rest of the field. G Mining Ventures ranked third at 50%, followed closely by Alamos Gold at 49% and K92 Mining at 45%.
The table also shows that revenue scale did not always translate into the highest margins. Newmont, ranked second by revenue, had the highest net income in the table at $9.90 billion, but its margin was 32%. Barrick Mining posted $6.98 billion in net income on a 30% margin, while Agnico Eagle Mines recorded $6.24 billion on a stronger 37% margin.
At the lower end, six companies had negative net profit margins: First Quantum Minerals, Equinox Gold, Allied Gold, Taseko Mines, Endeavour Silver and Asante Gold. Asante Gold had the weakest margin at –69%, followed by Endeavour Silver at –26%.
NET INCOME CHANGE: TABLE 3
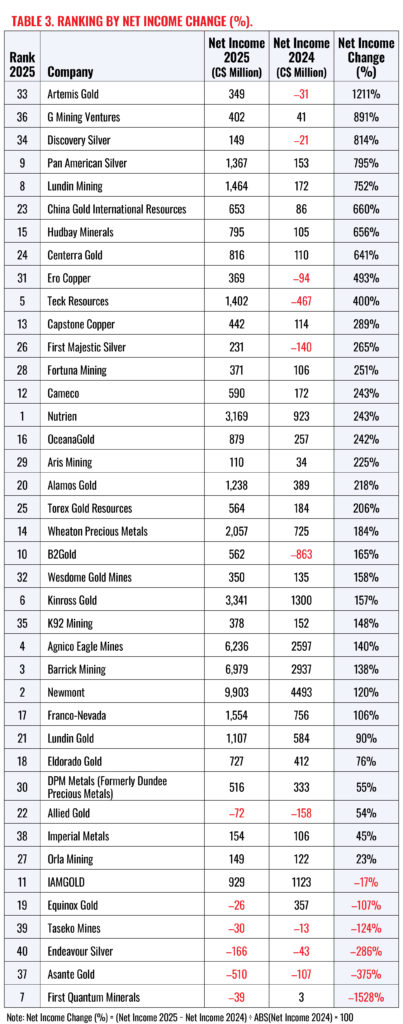
Table 3 shows earnings rebound across the 2025 Top 40, with several companies moving sharply from losses or low 2024 earnings into stronger profitability. Artemis Gold posted the largest net income change, up 1,211%, followed by G Mining Ventures at 891% and Discovery Silver at 814%. Pan American Silver, Lundin Mining, China Gold International Resources, Hudbay Minerals and Centerra Gold also posted gains above 600%. Among the majors, Agnico Eagle Mines, Barrick Mining, Newmont and Nutrien delivered strong increases.
However, the table also shows pressure, with First Quantum, Asante, Endeavour Silver, Taseko and Equinox posting negative changes.
REVENUE GROWTH RATE LEADERS: TABLE 4
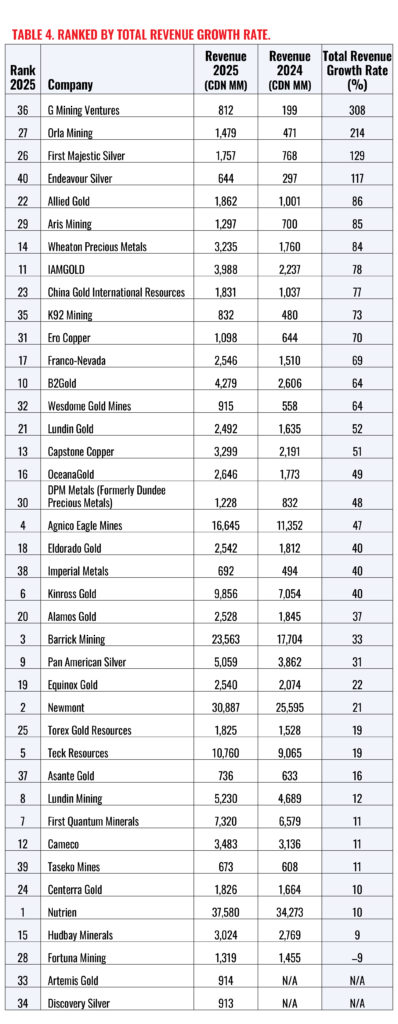
Revenue growth was widespread, but the sharpest percentage gains came from companies moving off smaller 2024 bases, while the major producers delivered the largest dollar increases.
Table 4 shows broad revenue growth across the Top 40, with 37 of the 38 companies with comparable 2024 figures posting revenue increases. Only Fortuna Mining recorded a decline, with revenue down 9% to $1.32 billion.
G Mining Ventures led the table with revenue growth of 308%, rising to $812 million from $199 million. Orla Mining followed with growth of 214%, reaching $1.48 billion.
First Majestic Silver ranked third at 129%, while Endeavour Silver grew 117%.
The table also shows strength beyond the fastest-growing smaller names. Allied Gold, Aris Mining, Wheaton Precious Metals, IAMGOLD, China Gold International Resources and K92 Mining all posted growth above 70%.
Among the larger companies, the absolute gains were significant. Barrick Mining increased revenue by about $5.86 billion, Agnico Eagle Mines by about $5.29 billion, and Newmont by about $5.29 billion.
RUNNERS-UP SHOW A DEEPER FIELD BENEATH THE TOP 40: TABLE 5
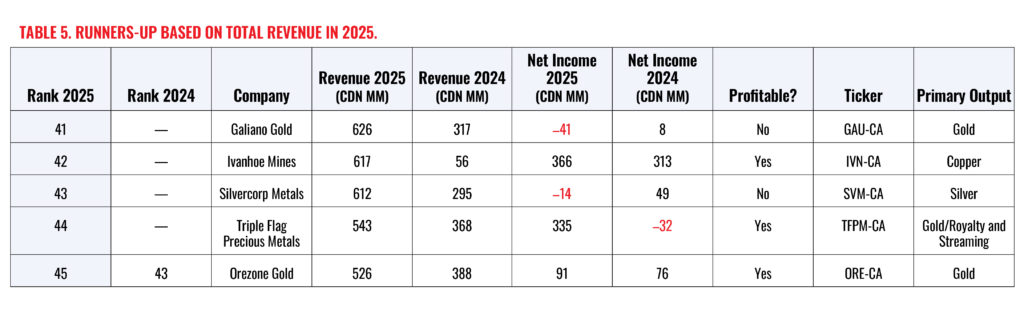
The 2025 runners-ups ranking in Table 5 points to a tighter, more competitive group just below the Top 40, with five companies clustered between $626 million and $526 million in revenue.
Together, Galiano Gold, Ivanhoe Mines, Silvercorp Metals, Triple Flag Precious Metals and Orezone Gold generated $2.92 billion in 2025 revenue, up from $1.42 billion in 2024, representing growth of about 105% across the group.
The narrow spread is one of the clearest dynamics. Only $100 million separated #41 Galiano Gold from #45 Orezone Gold. The top three were even closer: Galiano at $626 million, Ivanhoe at $617 million and Silvercorp at $612 million. That $14-million gap between #41 and #43 shows how small changes in revenue can reshape the lower end of the Top 40 and the runners-up list.
Overall, the runners-up list reflects both opportunity and pressure. Revenue growth was broad, precious metals dominated and profitability was mixed. Modest shifts in revenue, margins or earnings could change next year’s ranking.
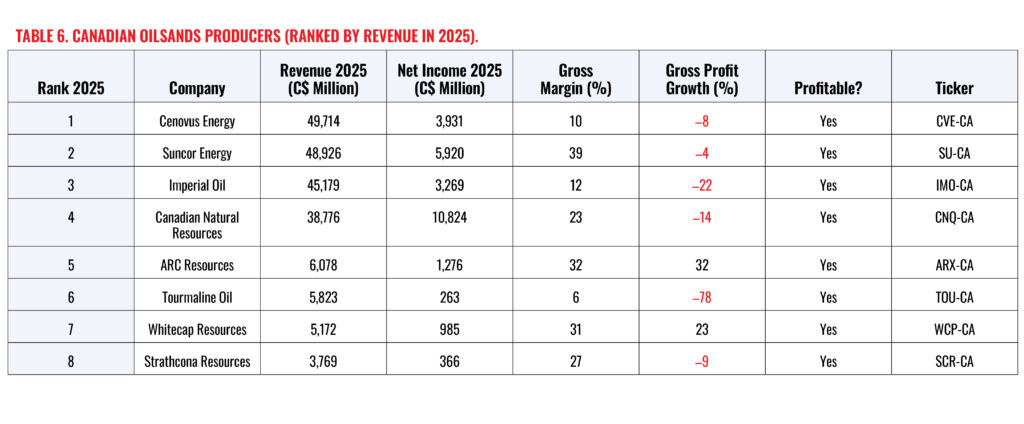
OILSANDS: TABLE 6
The 2025 oilsands ranking by revenue (Table 6) shows a concentrated and profitable sector, with eight companies generating $203.44 billion in revenue and $26.83 billion in net income. Cenovus Energy led by revenue at $49.71 billion, narrowly ahead of Suncor Energy at $48.93 billion. Imperial Oil ranked third at $45.18 billion, followed by Canadian Natural Resources at $38.78 billion. Together, the top four accounted for 90% of total revenue.
Profitability told a different story. Canadian Natural ranked fourth by revenue but led the group in net income, with $10.82 billion. Suncor had the strongest gross margin at 39%, while Tourmaline Oil had the weakest at 6%. Gross profit growth was mostly negative, with only ARC Resources and Whitecap Resources posting gains. The table points to a sector still highly profitable but facing pressure on gross profit performance.

Related Posts
Scania to charge MacLean’s net‑zero push
July 27, 2026
Scania to charge MacLean’s net‑zero push
Quebec selects Troilus for accelerated permitting stream
July 27, 2026
Quebec selects Troilus for accelerated permitting stream
Maestro enlists Surety to bolster Nevada IIoT support
July 27, 2026
Maestro enlists Surety to bolster Nevada IIoT support
MAX Power Mining increases landholding at Lawson hydrogen project in Saskatchewan

Comments