[caption id="attachment_1003744757" align="aligncenter" width="550"]
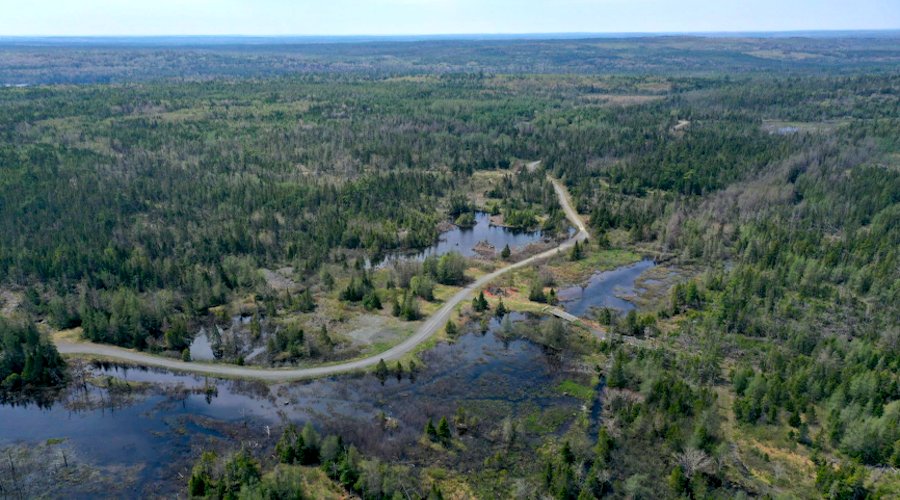
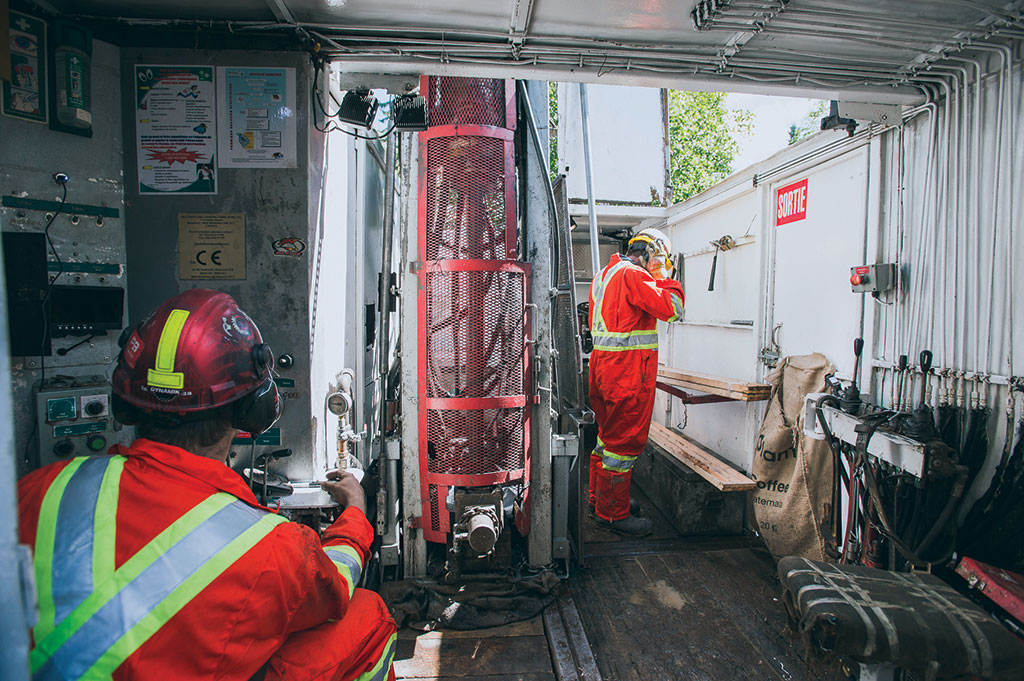
 Great Bear Resources employees study a drill map Credit: Great Bear Resources
[/caption]
Of the 123 global gold projects with completed feasibility studies or ones being worked on, 50 projects are orogenic deposits; 24 are epithermal deposit types, and eight are porphyry deposits, according to Glacier Resource Innovation Group’s
Mining Intelligence database.
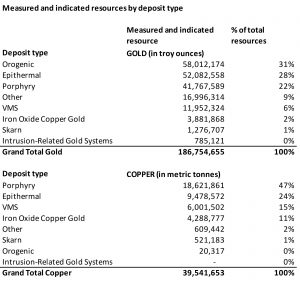
The other deposit types are volcanogenic massive sulphide (VMS) deposit projects at 16; iron oxide copper gold at six; skarn at four; and intrusion-related deposits at one.
“The orogenic and epithermal deposits make up about 59% of the defined gold in the ground at the feasibility stage, and 41% are orogenic deposit types,” says Katja Freitag, the manager of Mining Intelligence, a research and database owned by Glacier Resource Innovation Group. “Epithermal deposits generally have double the amount of gold in them than orogenic deposits and while porphyries are copper deposits, they are very significant when it comes to gold.”
When analyzing the amount of gold resources in the measured and indicated categories of the 123 projects with feasibility studies, she added, orogenic deposits account for the lion’s share (31%); followed by epithermal (28%); porphyries (22%); VMS deposits (6%); IOCG deposits (2%) and skarns (1%). In total the gold projects with feasibility studies contain about 186.8 million gold ounces.
Eight of the 24 epithermal deposits outlined in her study were in Chile and Mexico, and 27 of the orogenic deposits were in Canada and Australia, however “on average those in Canada seem to have significantly larger resources,” she noted. Most of the porphyry deposits with feasibility studies were in the province of British Columbia.
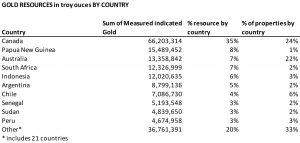
Breaking it down by country, Freitag says, Canada comes out on top of the list of countries with the most gold contained in the measured and indicated resource category (66.2 million oz. gold), followed by Papua New Guinea (15.5 million oz. gold); Australia (13.4 million oz. gold); South Africa (12.3 million oz. gold) and Indonesia (12.0 million oz. gold).
The remaining countries in the top ten feature: Argentina (8.8 million oz. gold); Chile (7.1 million oz. gold); Senegal (5.2 million oz. gold); Sudan (4.8 million oz. gold); and Peru (4.7 million oz. gold).
This story first appeared on www.NorthernMiner.com.

Comments